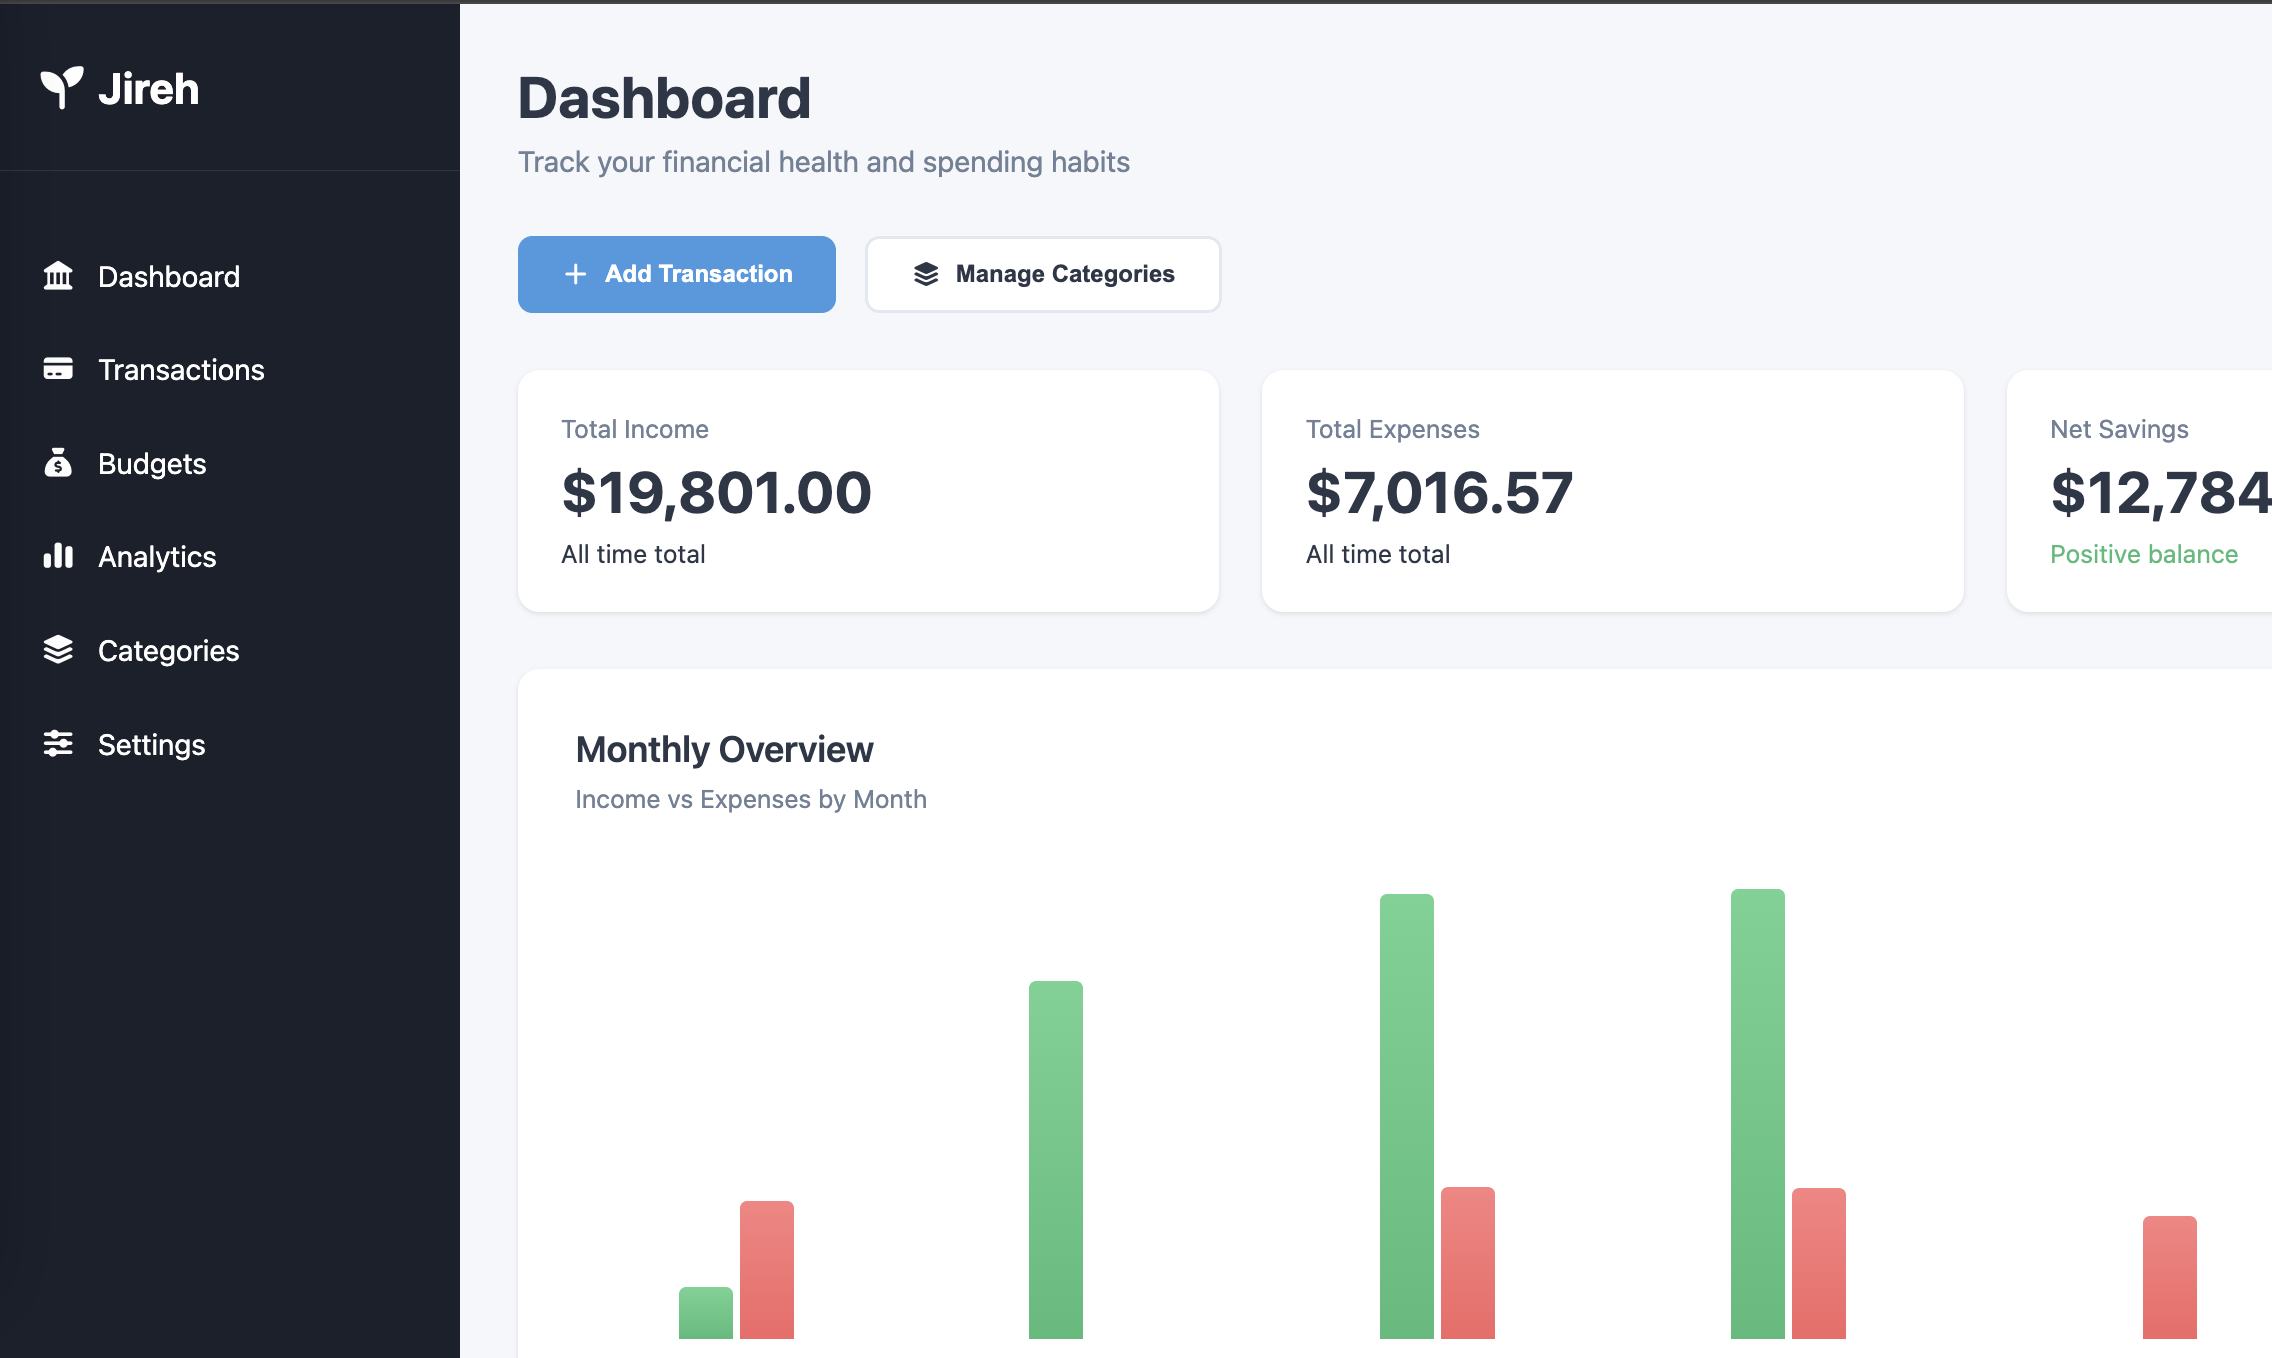
Dashboard overview
Shows total income, expenses, and net flow with a monthly bar chart, plus a feed of recent transactions for quick review.
A customizable multi-user budgeting tool for tracking expenses and budgets, in a clean and organized way.
As of February 2026, I've been reworking the full structure of the app. You can still see details of version 1 below, however the live version now reflects the new version as I make changes.
Jireh App was built to replace the financial tracking spreadsheets I've been making every year since 2019. I wanted something more structured and consistent than the spreadsheets I rebuilt each January.
The app gives clear financial insights with customizable categories and budgets, and flexible analytics. It supports multiple users with completely separate data, and authentication runs through Google login.
You can access the live version using the link below. As it is user-based, authentication via Google is required.
Open AppThe app runs on a lightweight serverless architecture. Data is stored in a relational database, and backend routes handle user-scoped queries and validation.
The frontend is a static application that talks to the backend through simple endpoints. The schema keeps user data separated and uses indexes to keep analytics and dashboard queries fast.
Stack: TypeScript, HTML/CSS, SQLite, CF Workers, D1, Google OAuth
Shows total income, expenses, and net flow with a monthly bar chart, plus a feed of recent transactions for quick review.
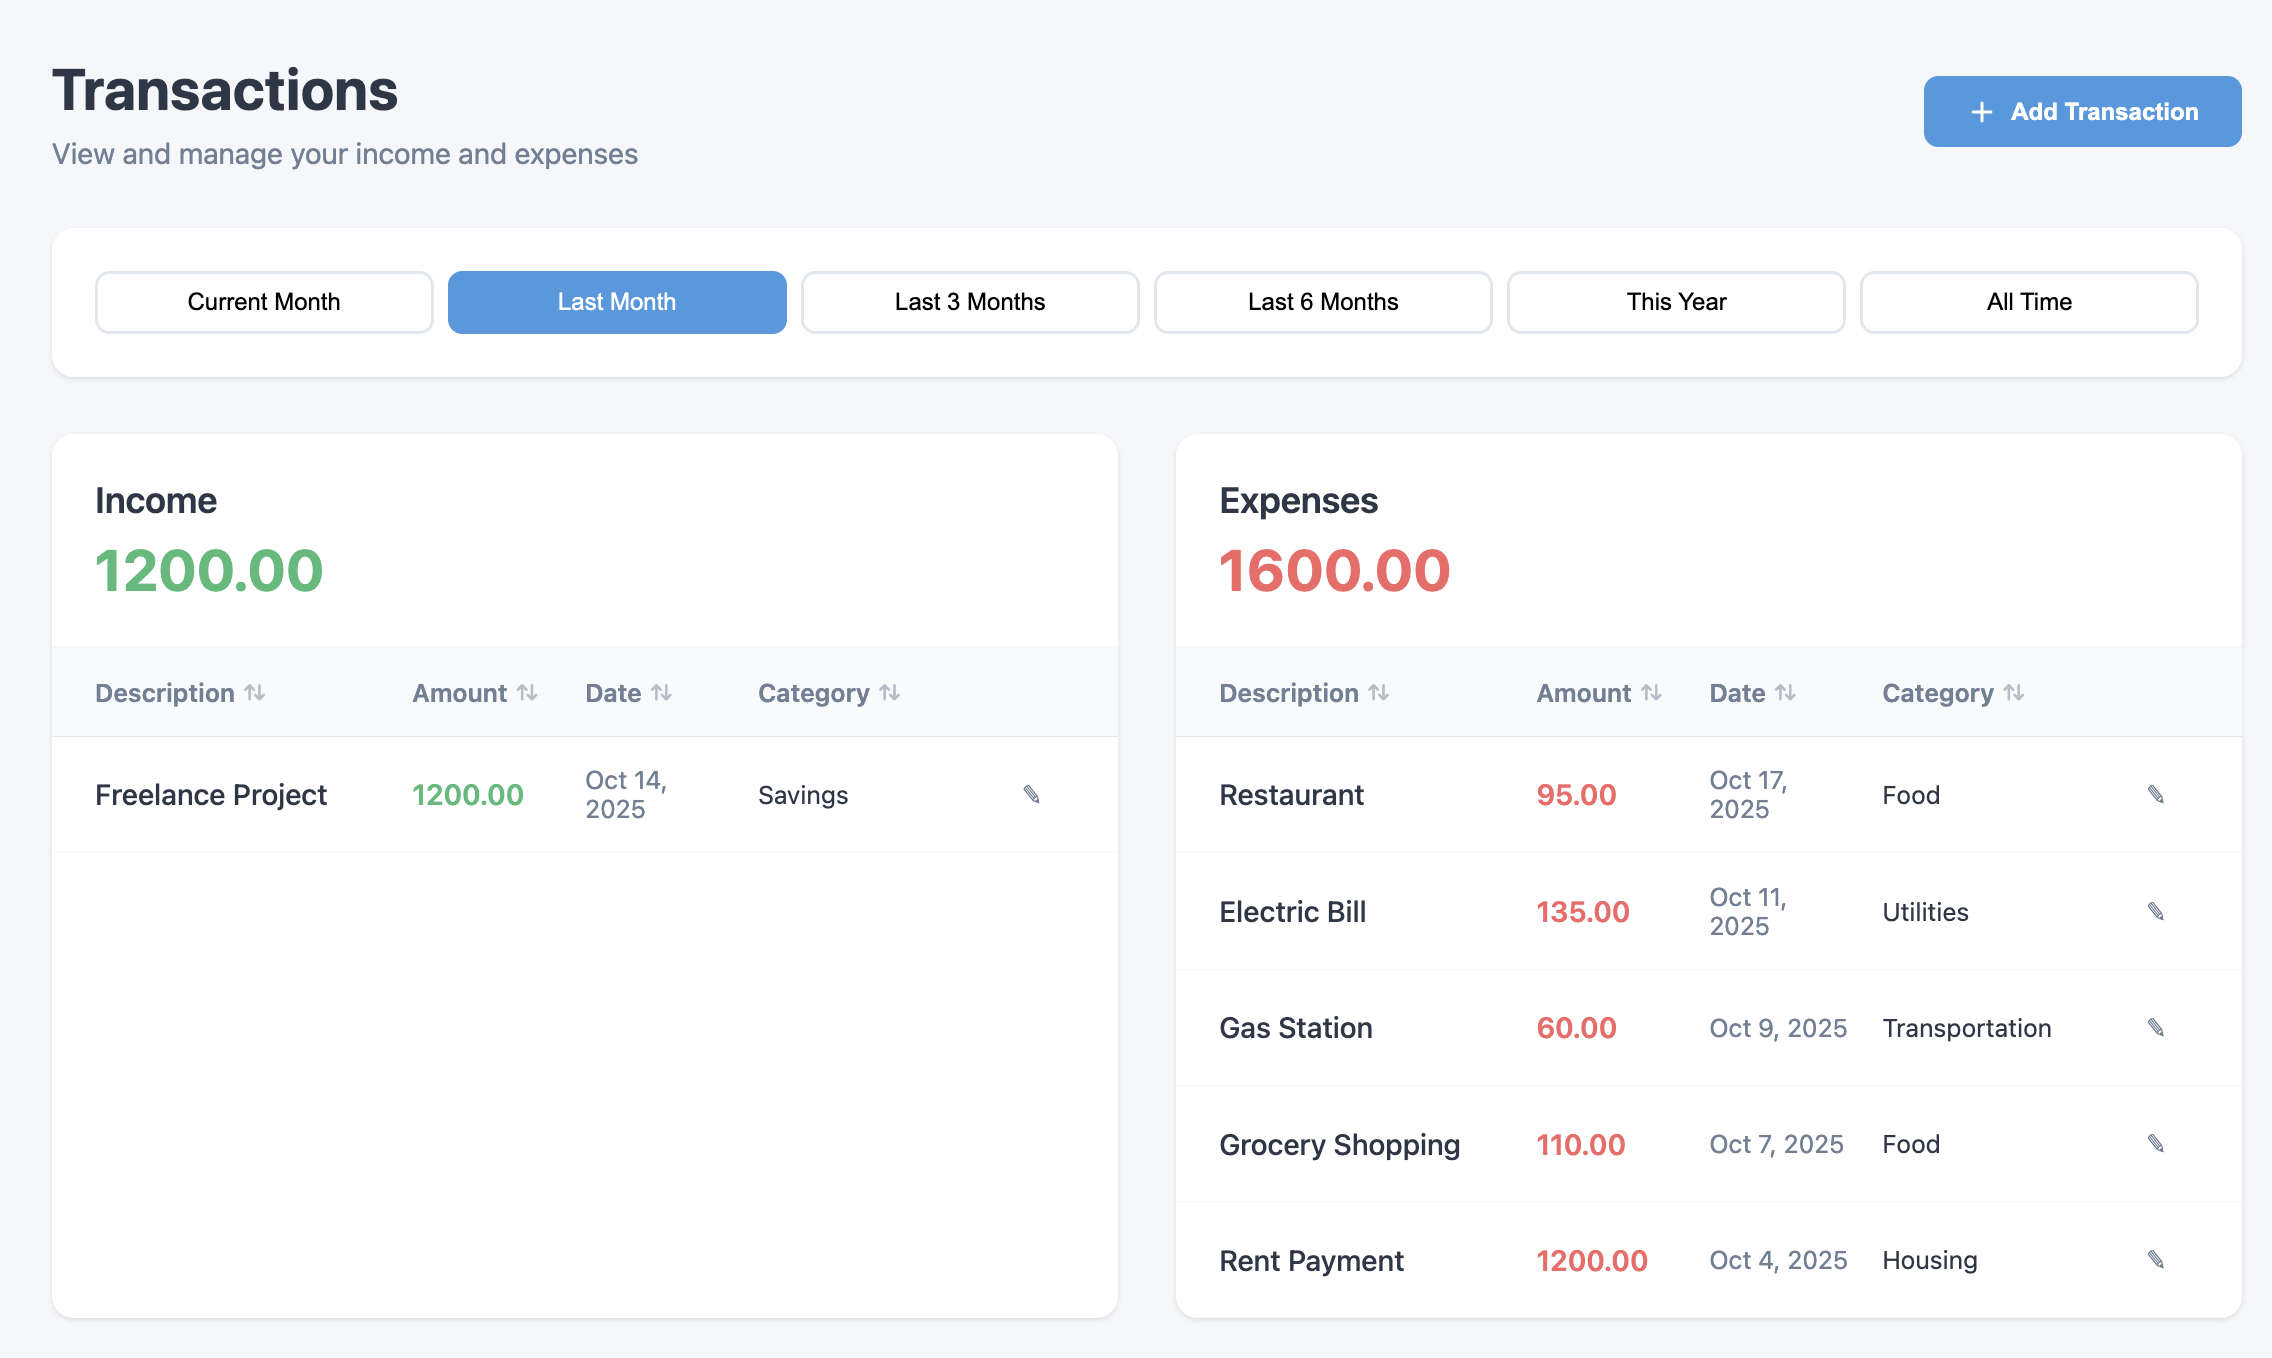
A full log of financial activity with filtering by date range, description, amount, category, or income/expense type. Supports manual transaction entry.
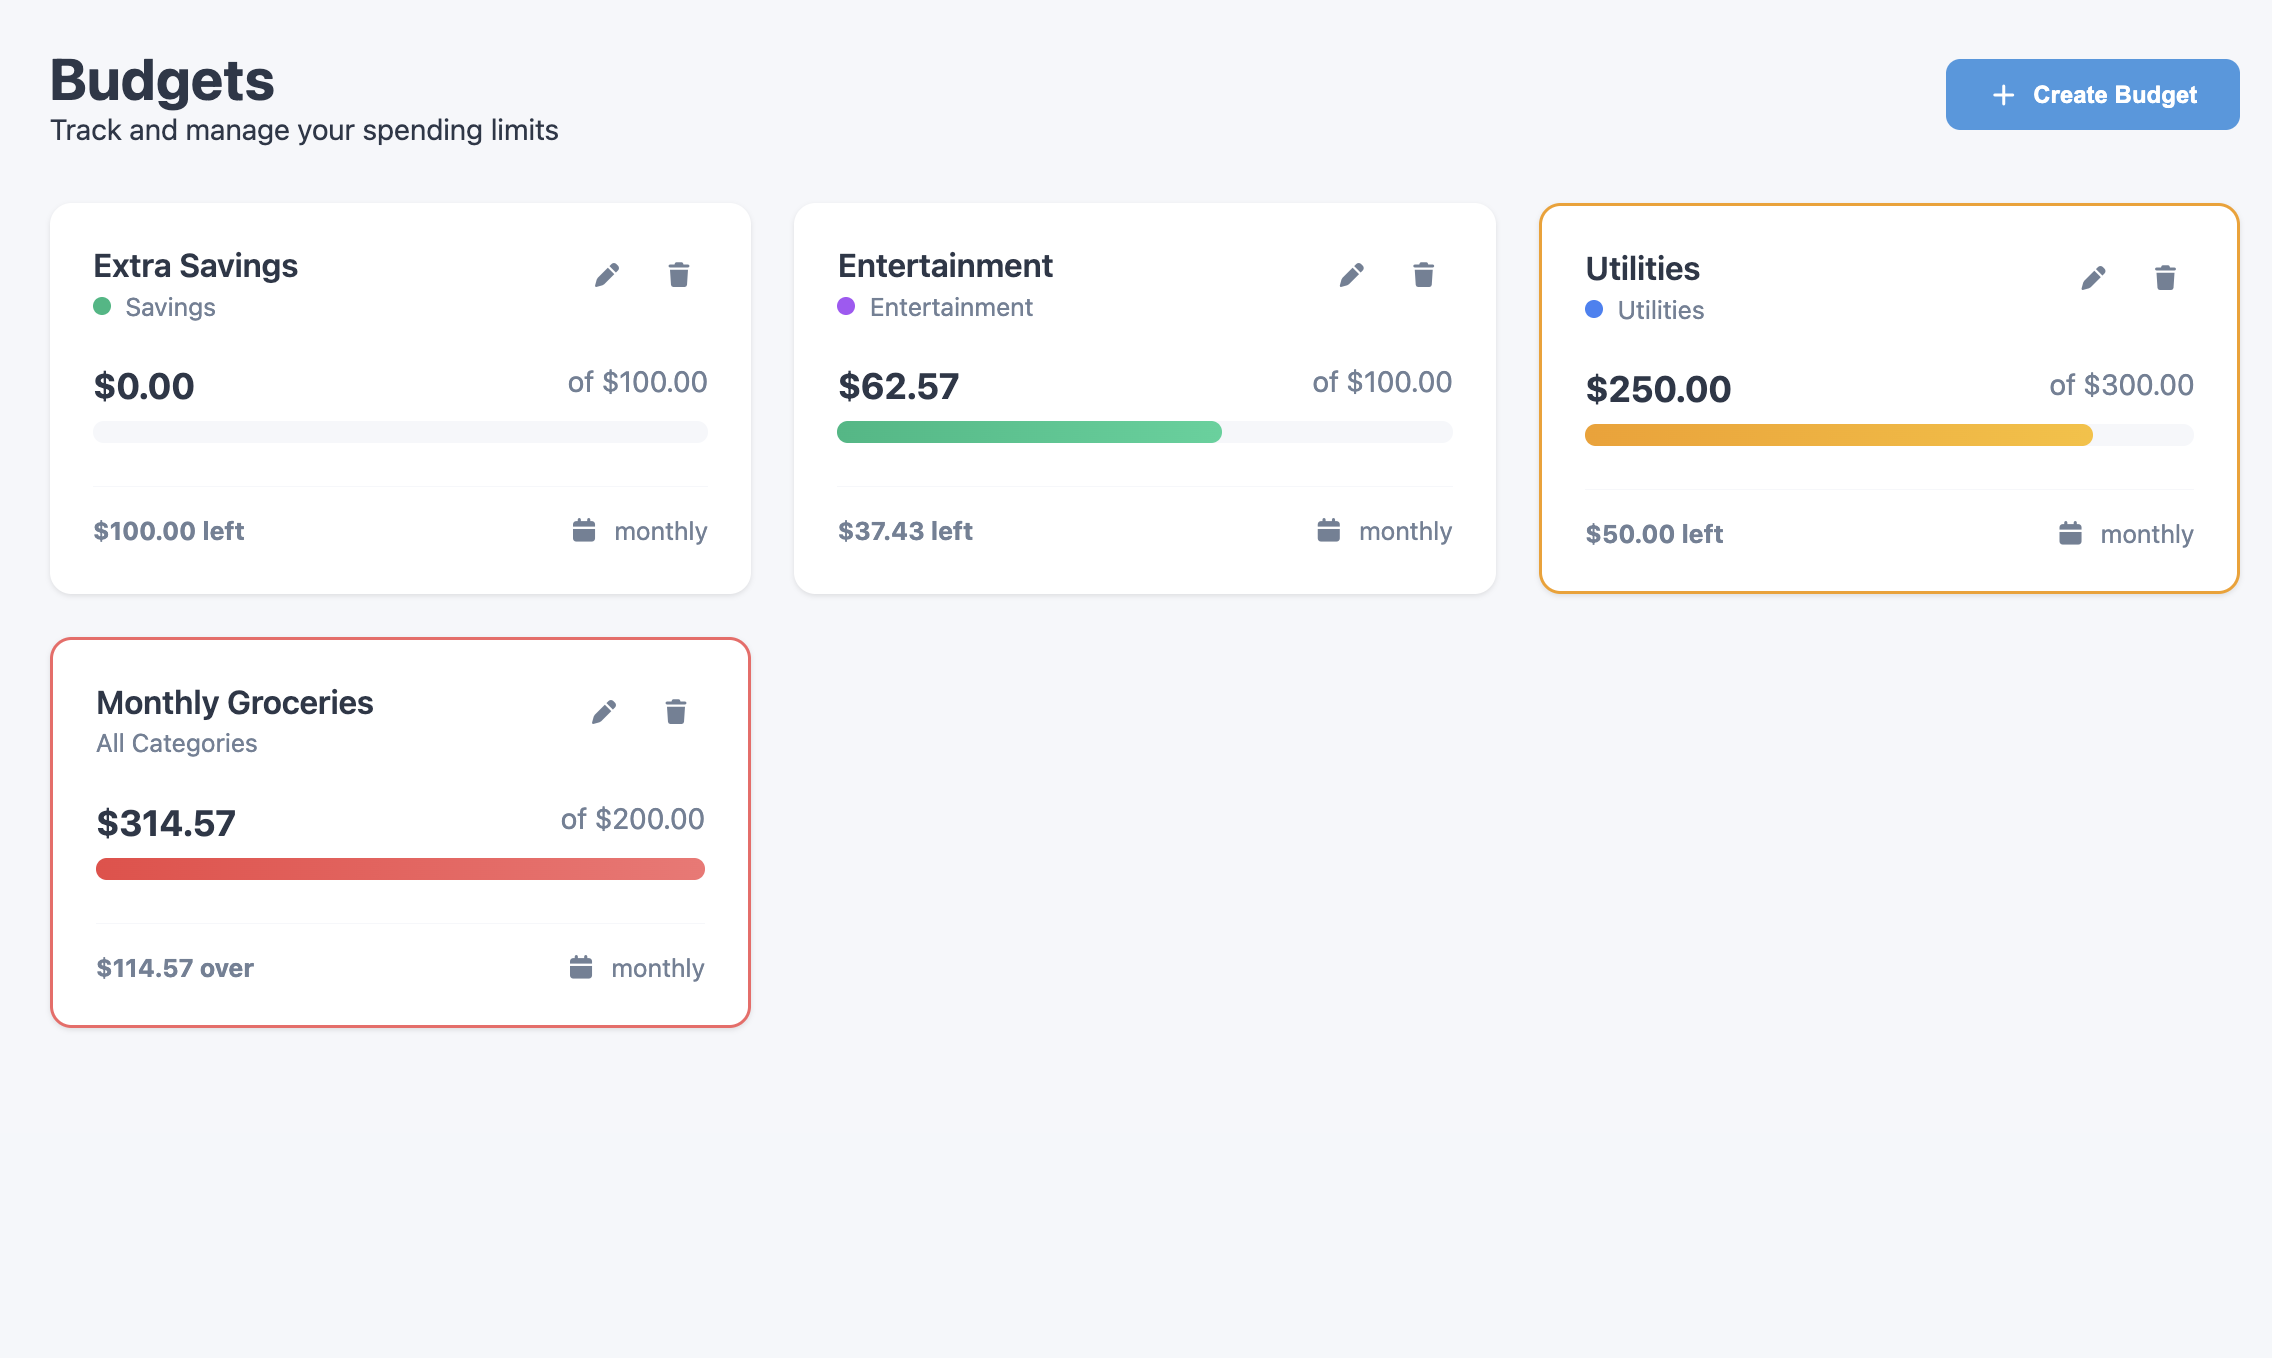
Create category-based budgets and track spending with visual indicators. New users get sample budgets to start from.
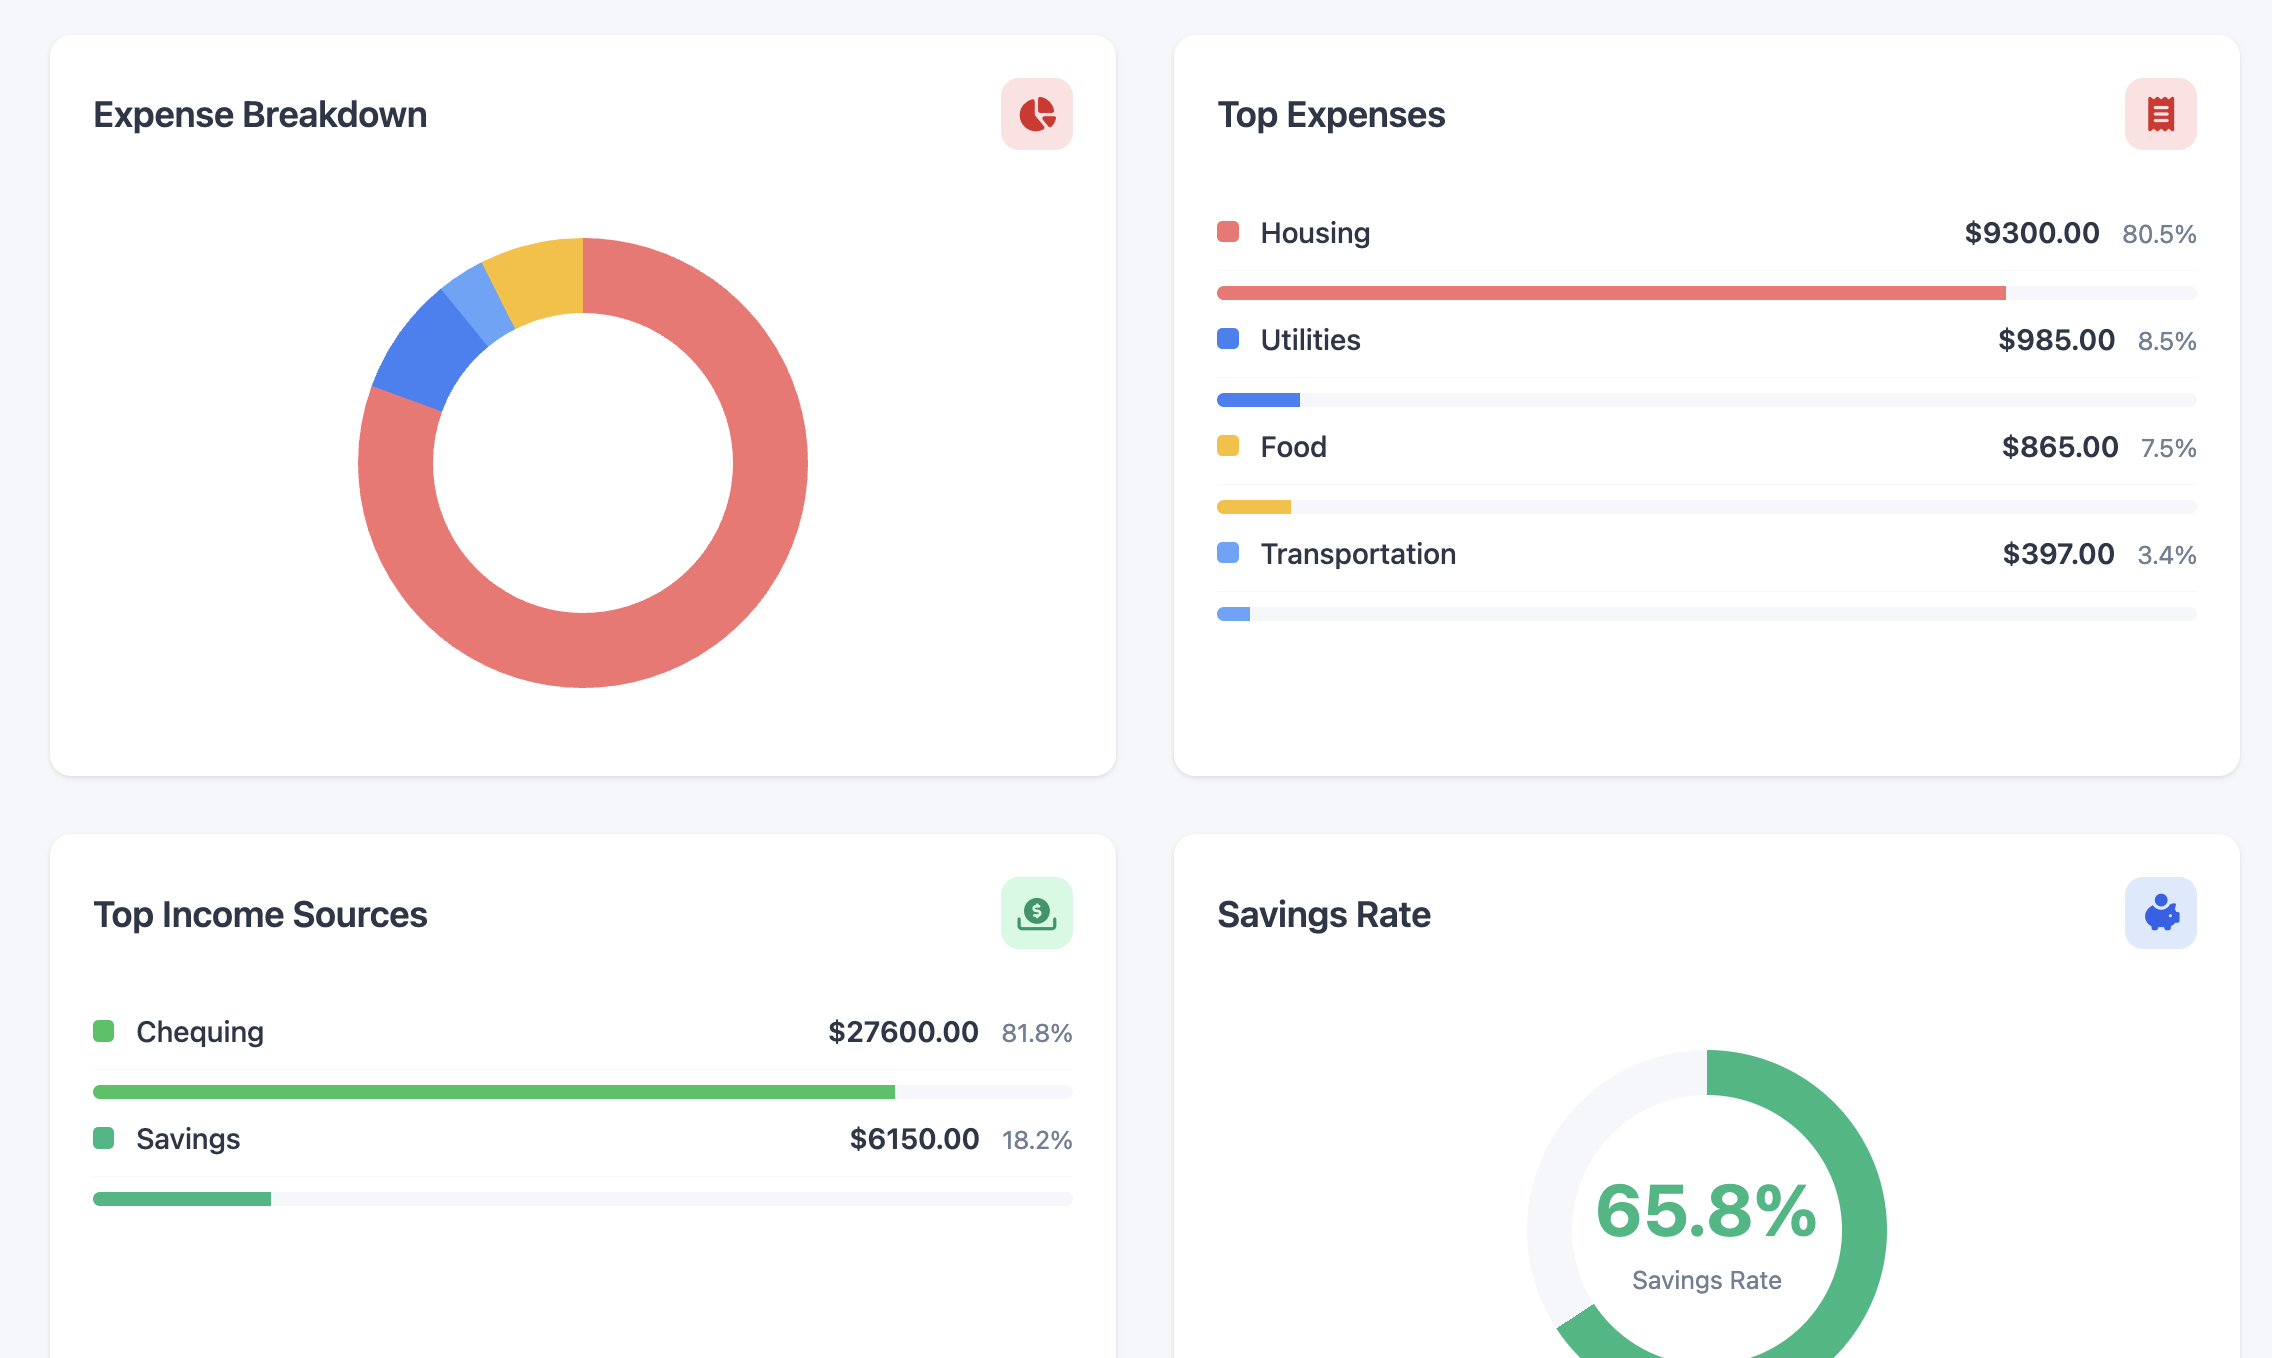
Spending and income breakdowns with charts, category pie graphs, and trend visualizations.
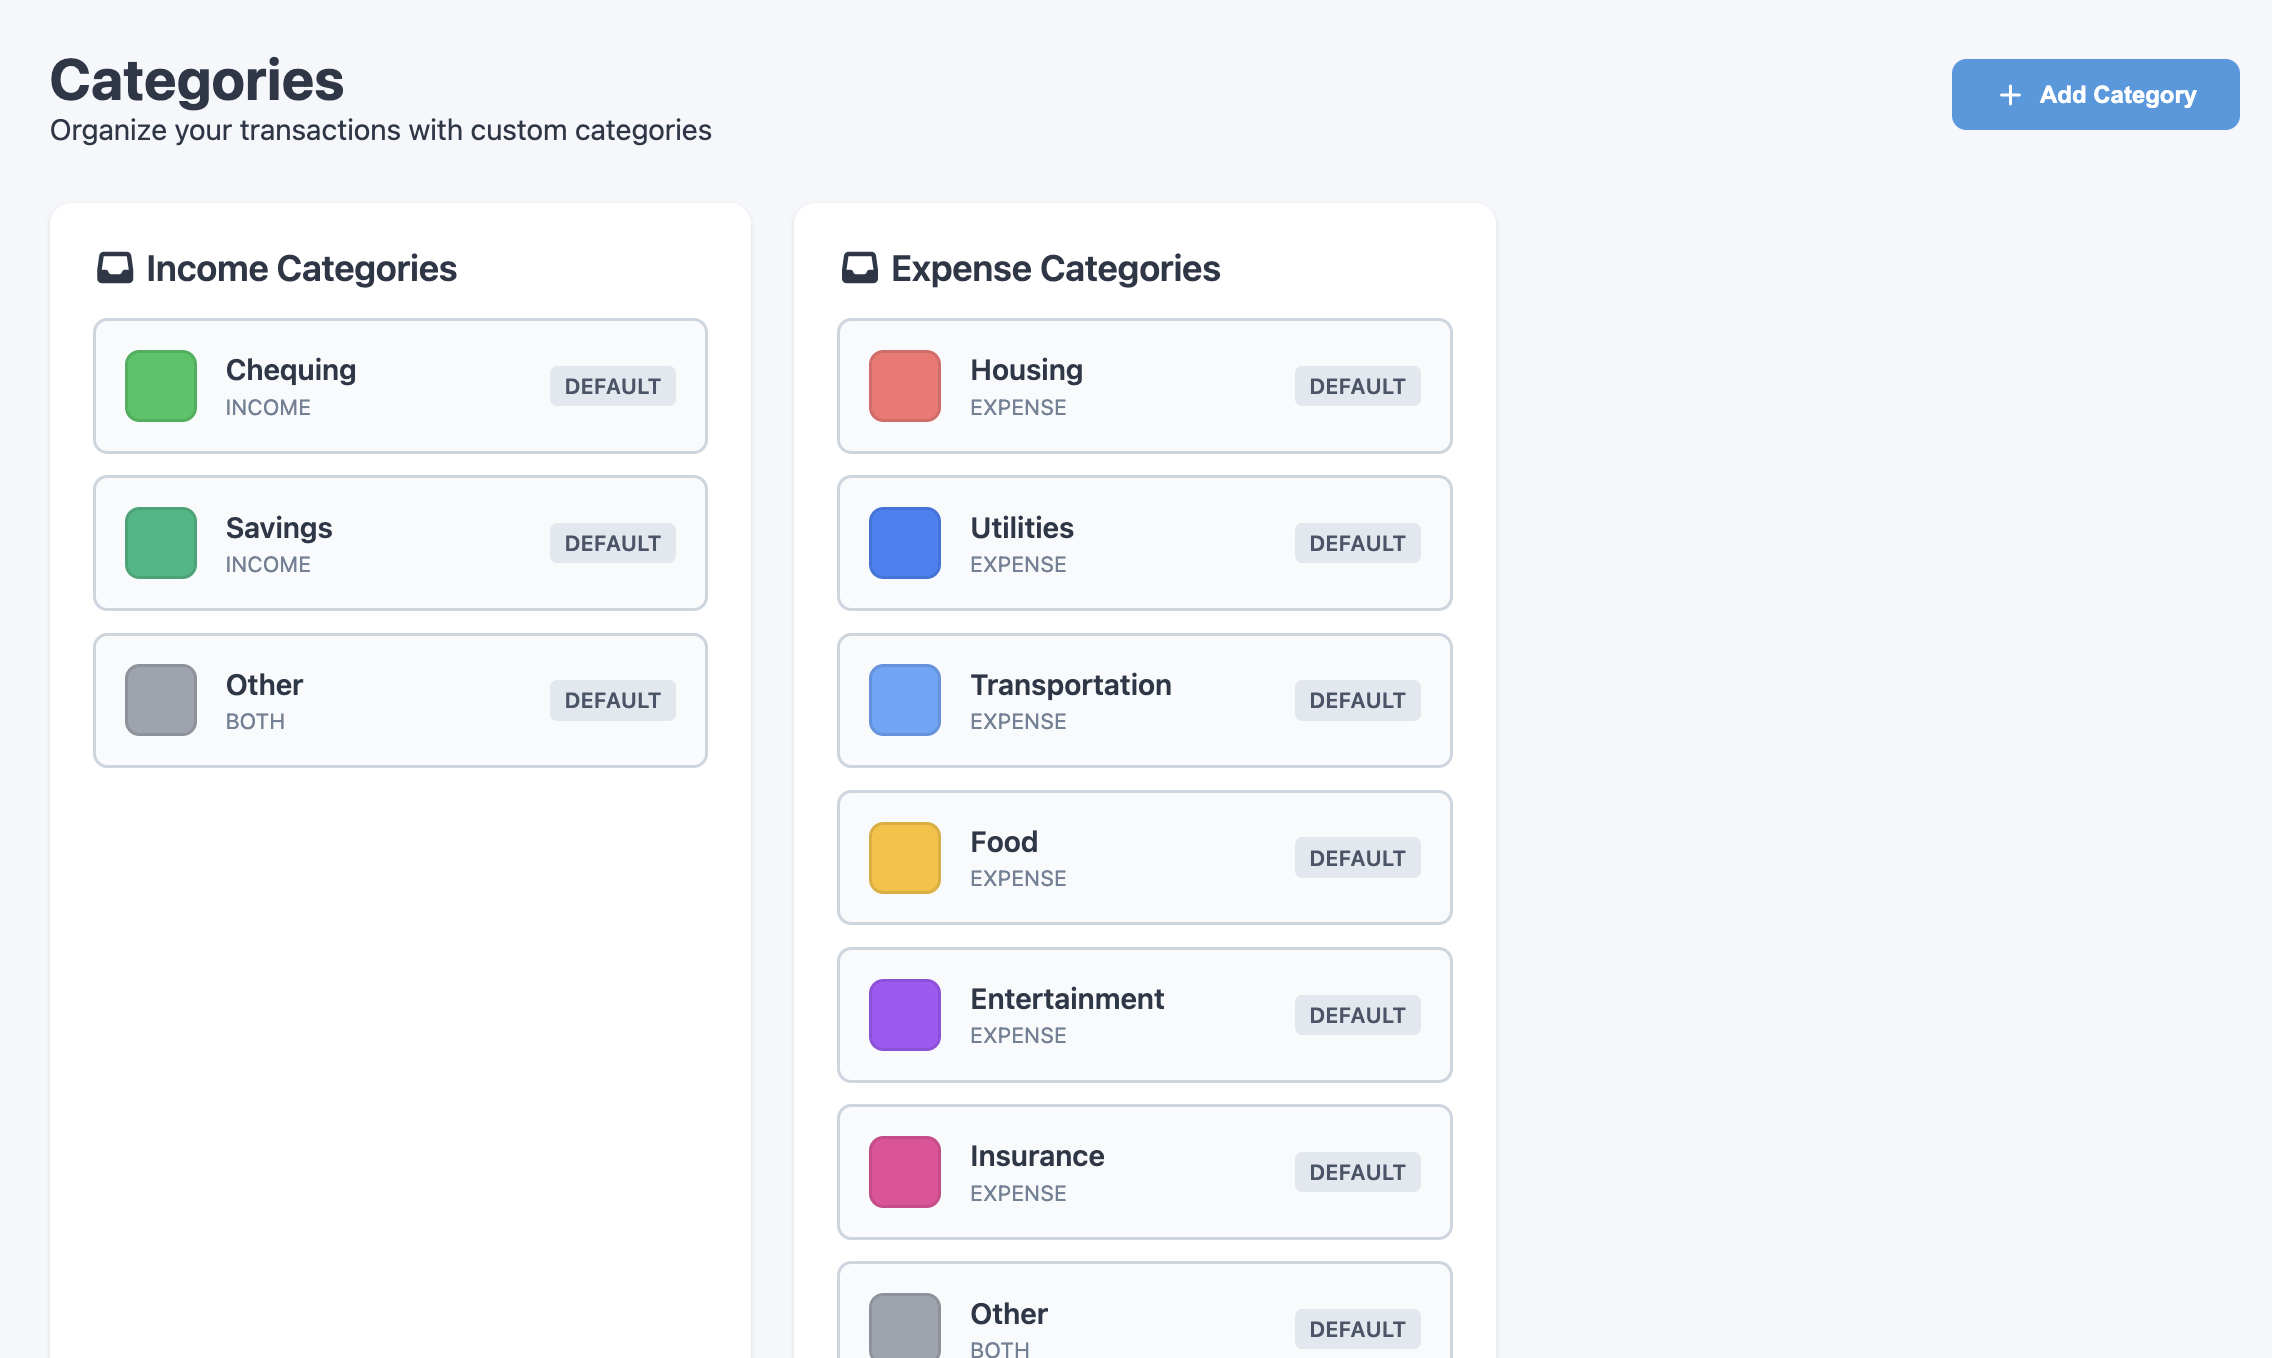
Add and customize categories with color assignments, keeping things consistent across the dashboard and analytics pages.
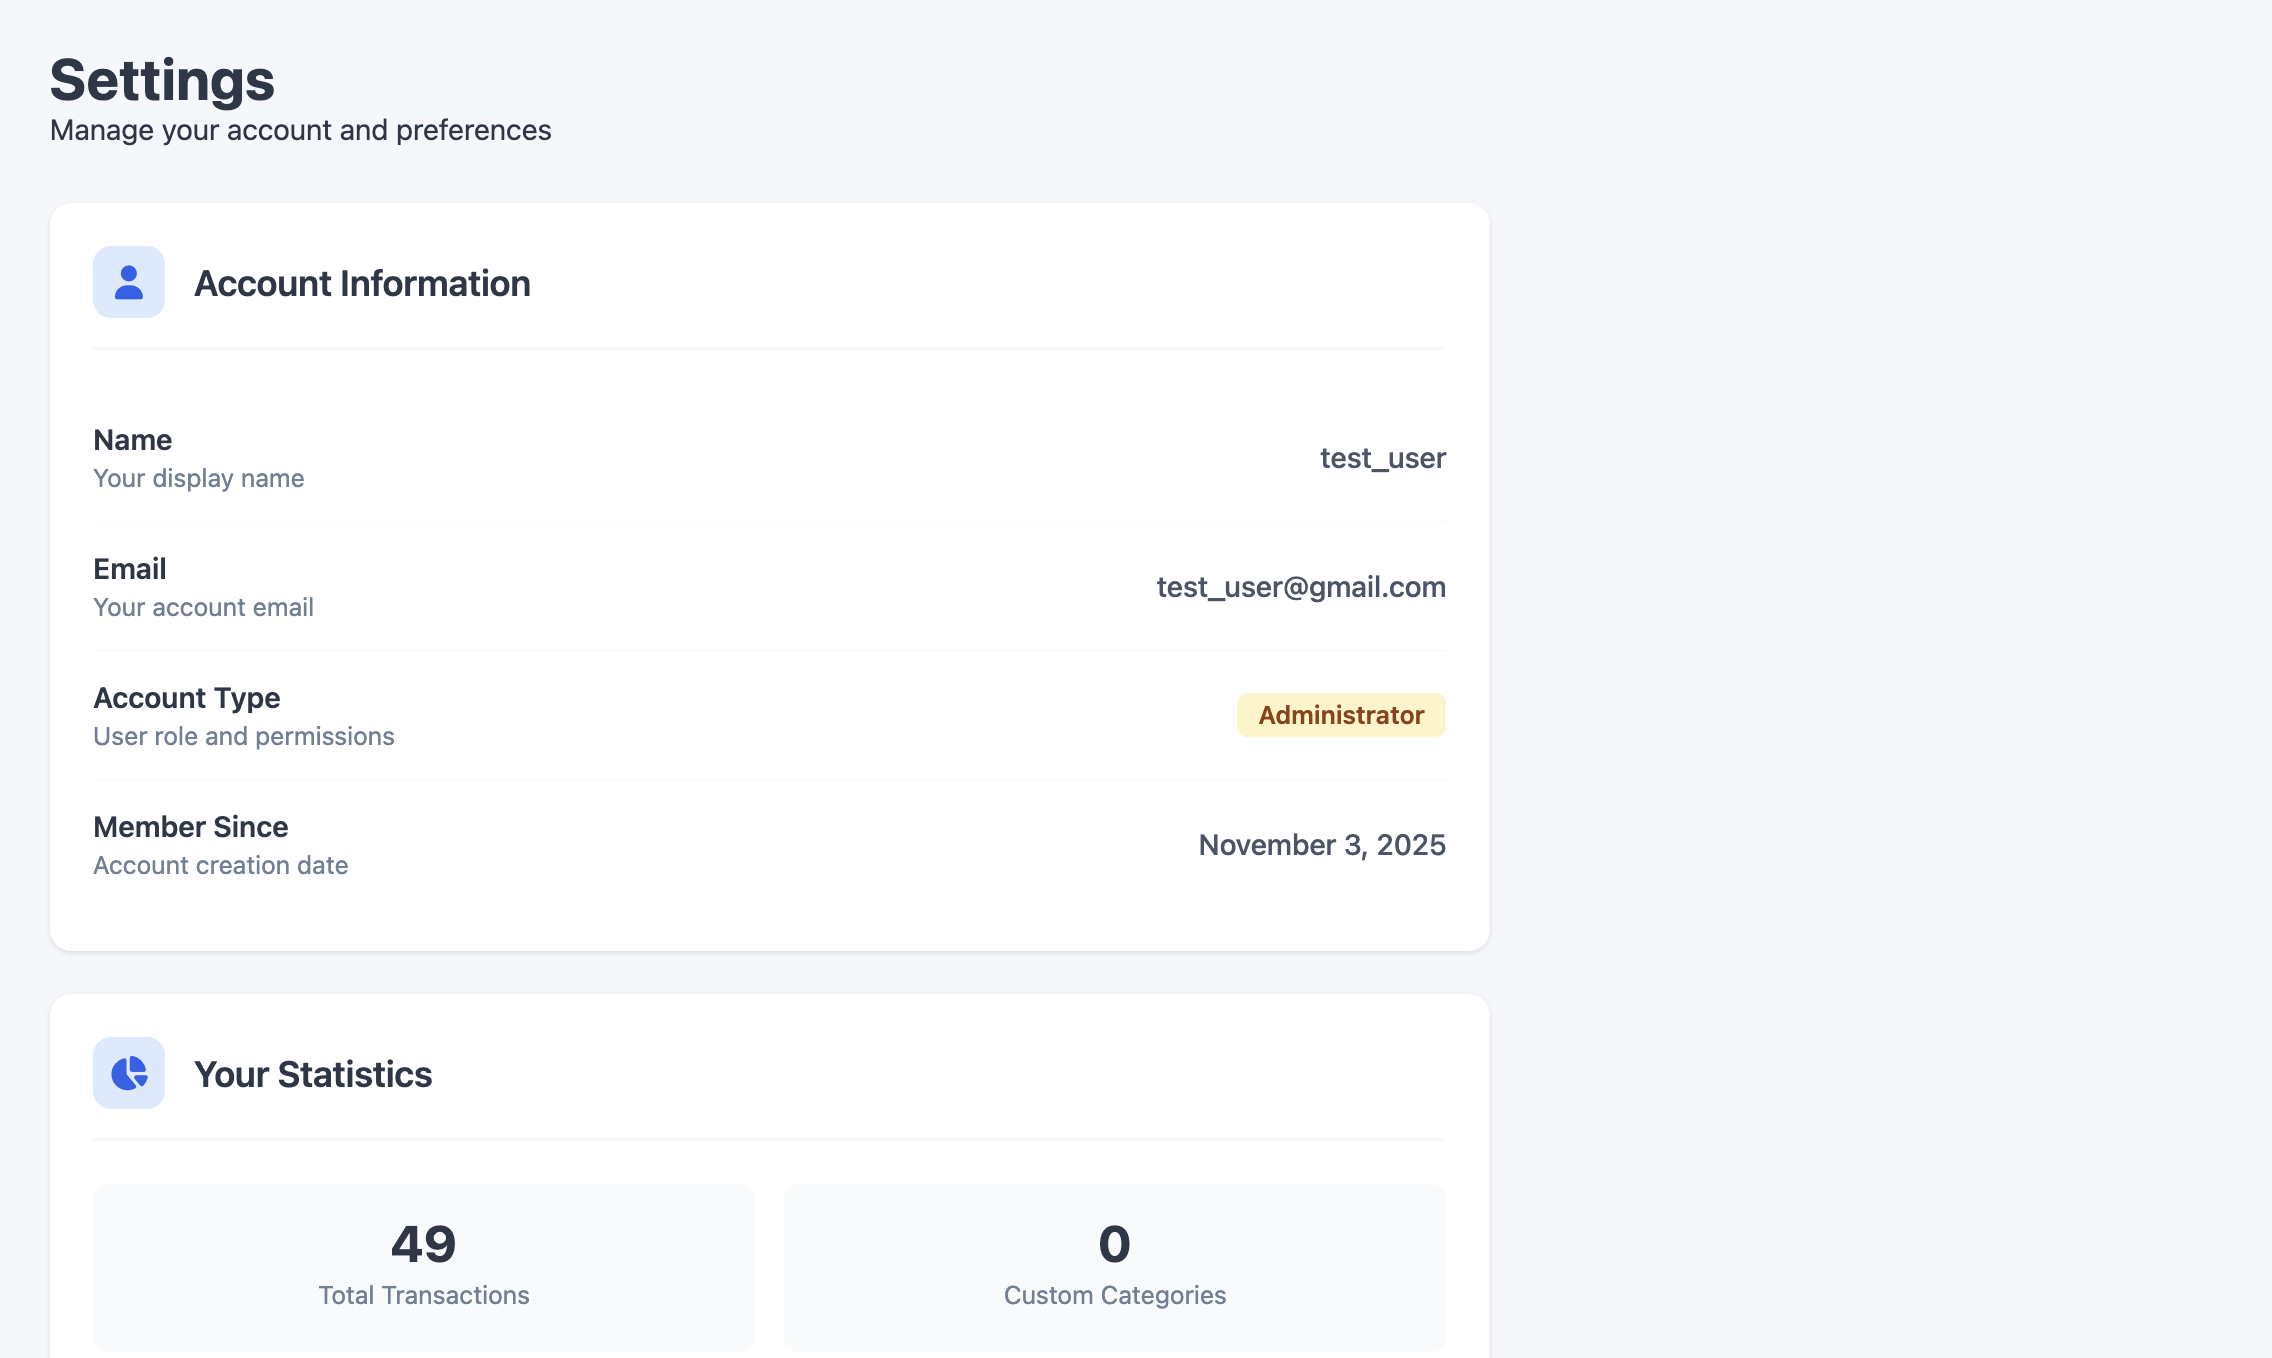
Manage account details, view usage statistics, export data to CSV/JSON, and submit feedback directly.
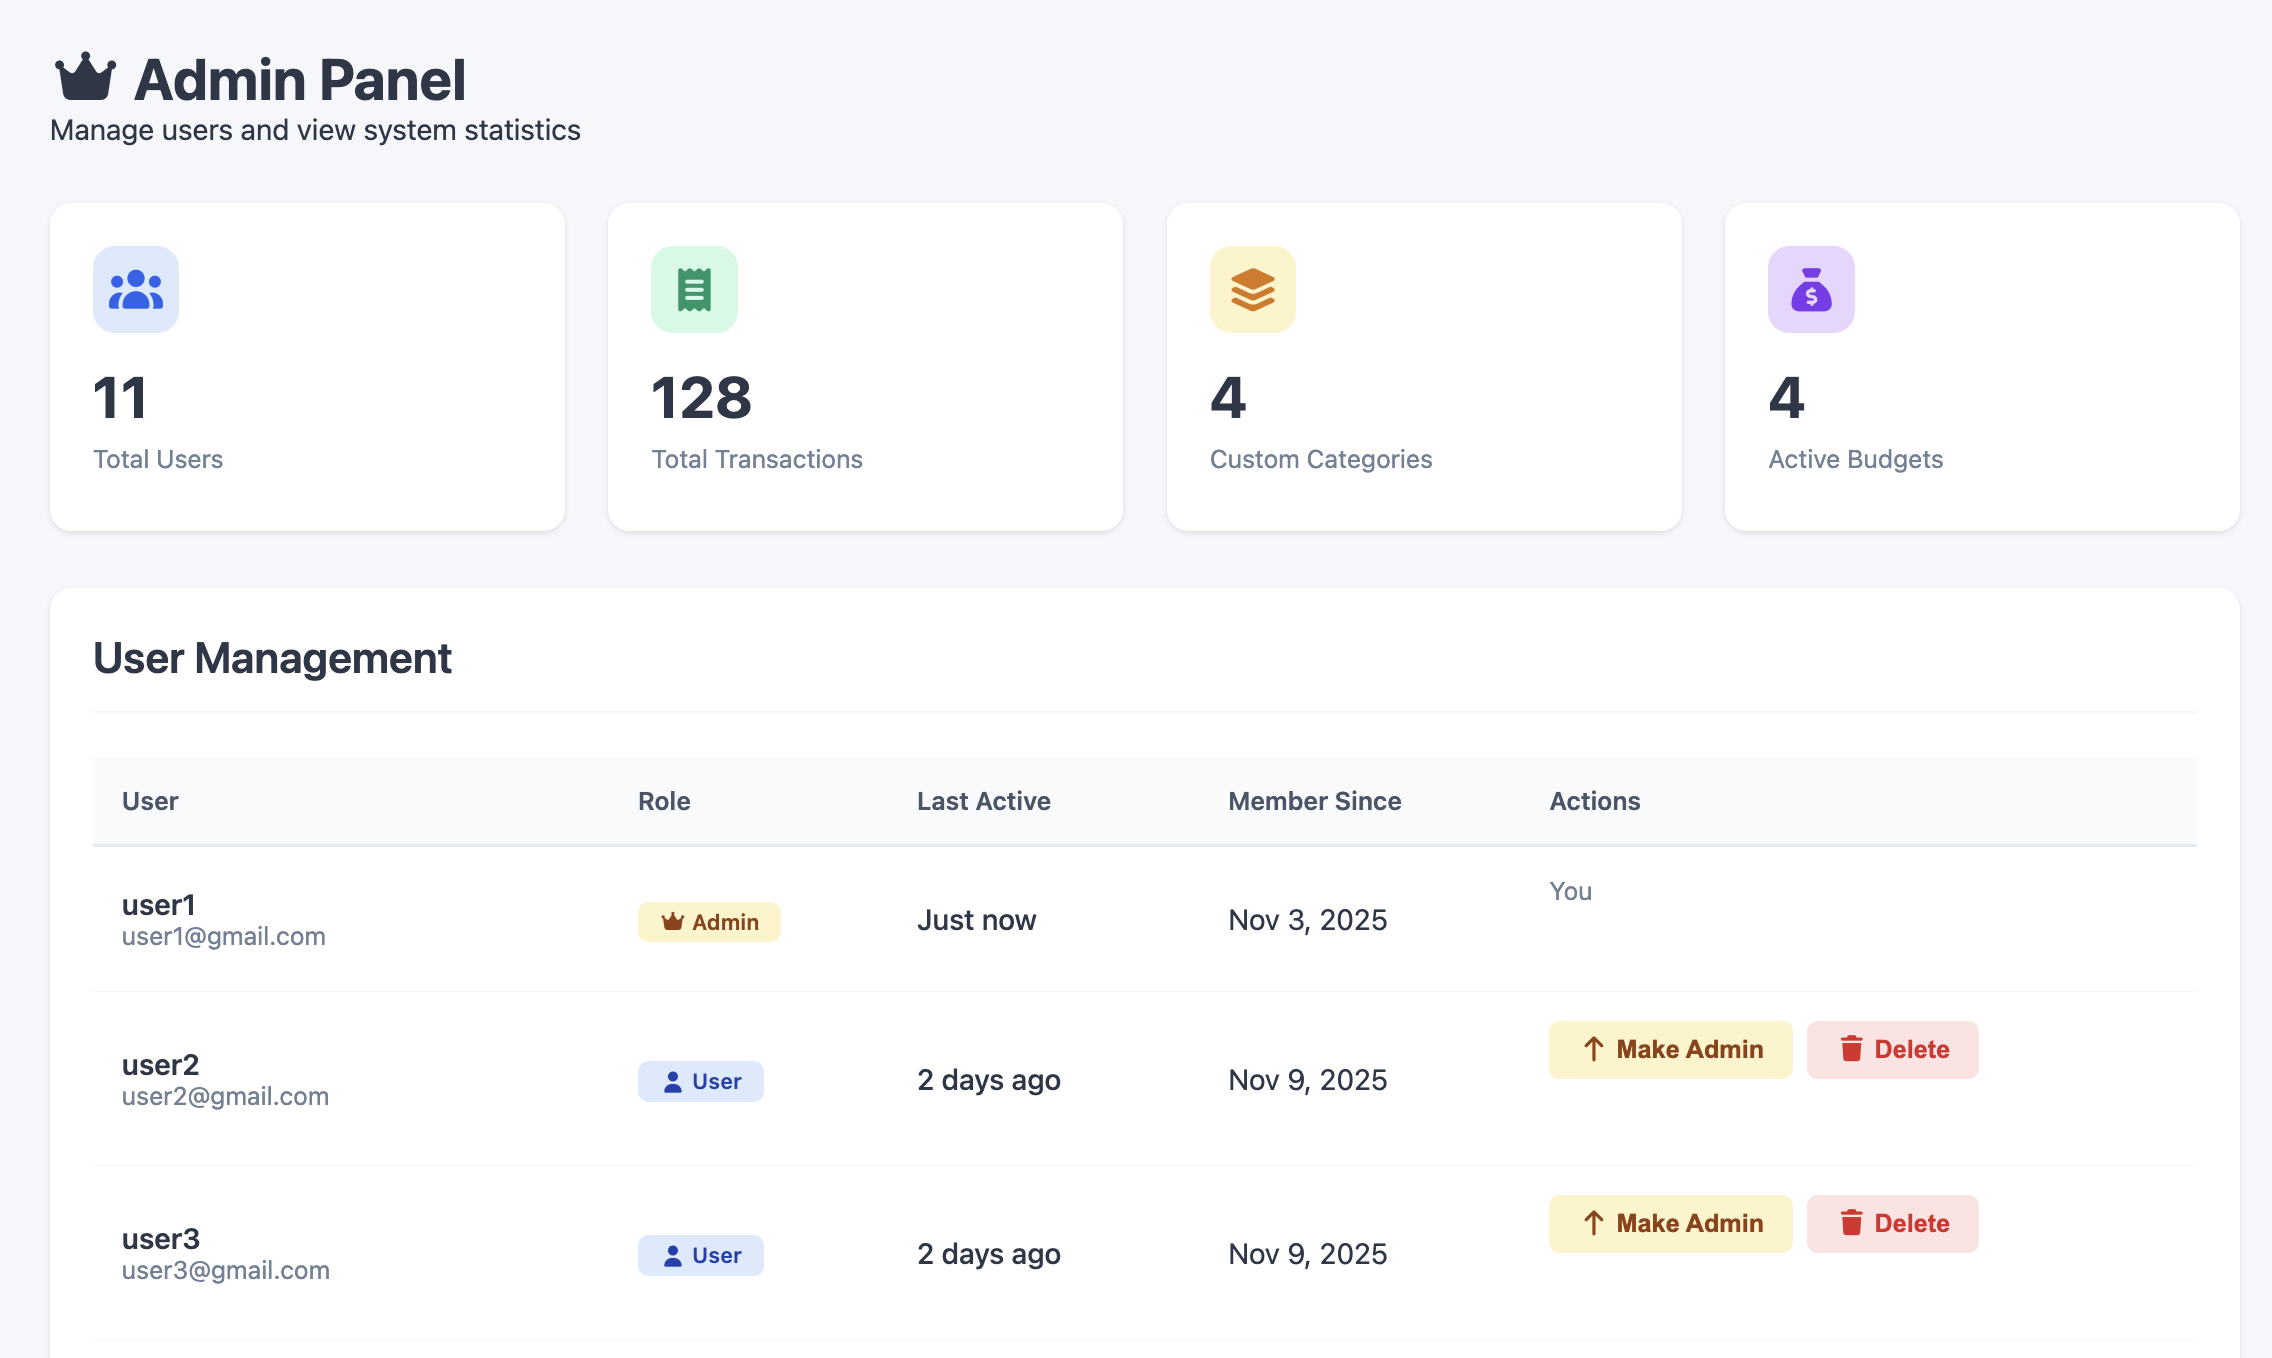
An internal panel for managing users and viewing system-level information.